Research on the speed of symptom reduction of participants of the online program 15Minutes4Me.com (depression, anxiety and stress symptoms)
This page contains the description of the research presented at the 23rd WPA World Congress of Psychiatry 2023 by Julia Burggraaf, Ph.D. and Paul Koeck, M.D.
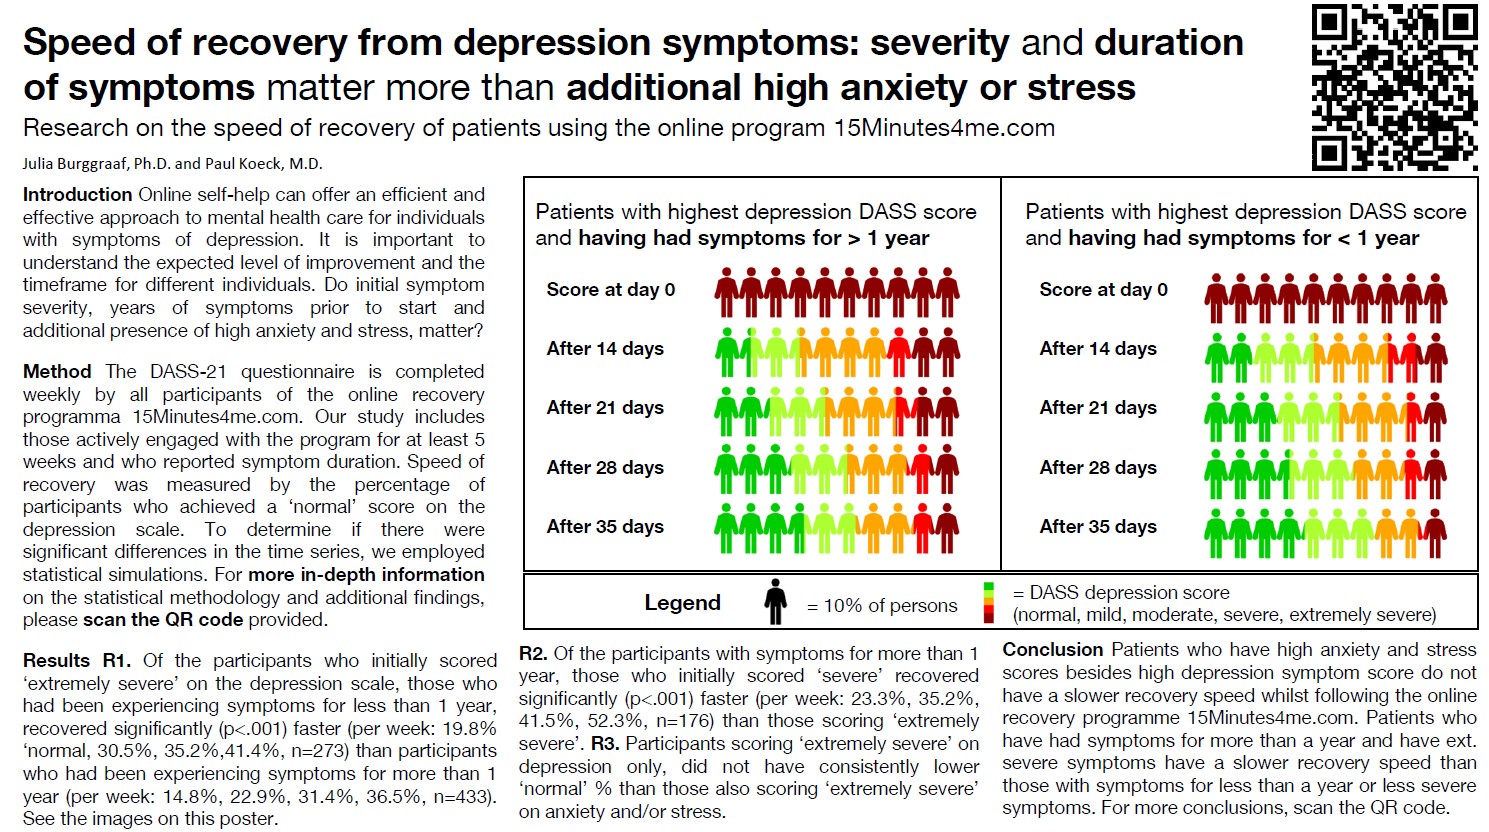
Introduction
There are online programs designed to assist people in reducing their symptoms related to depression, anxiety and stress. These programs offer various advantages, particularly individuals can engage with them independently, without the need for direct interaction with a healthcare professional. This approach brings about several benefits, such as reducing the burden on the healthcare system and delivering prompt care to patients who might otherwise end up on a waiting list. However, these benefits only come to fruition if the program itself is effective.
For any program or intervention to be effective, it necessitates active participation from the individual. One challenge with online programs can be that it is up to the participant to decide how long to follow the program. General Practitioners (GPs) GP can play a pivotal role in helping participants decide the optimal duration for their program involvement. It's important for both participants and supporting GPs to have an idea of when one might reasonably anticipate a reduction in symptoms. The rate of symptom reduction, referred to hereafter as the 'speed of recovery', varies from person to person.
In our research, we investigated which factors significantly influence the speed of recovery. Identifying these influential factors holds the potential to forecast how quickly a particular patient might recover. We put forth three factors which are hypothesized to influence the speed of recovery are: the severity of symptoms, the length of time the symptoms have been present previously, and the presence of comorbidities involving symptoms of depression, anxiety and stress. The following hypotheses are tested:
Hypothesis 1: The sympton duration hypothesis: Participants who have had symptoms for a longer period of time, recover slower than participants who have not had symptoms for a long time.
Hypothesis 2 The severity hypothesis: Participants who have more severe symptoms, recover slower on that scale than participants who have less severe symptoms.
Hypothesis 3: The comborbidity hypothesis: Participants who have an 'extremely severe' score on one scale, recover faster on that scale than participants who also score 'extremely severe' on one other scale, and participants who also score 'extremely severe' on both other scales, recover the slowest.
Method
The online program 15Minutes4me.com
The recovery speed was investigated among the participants of the online program 15Minutes4me.com. This is online program is build around the effective components of solution focused therapies and elements of other forms of therapy such as cognitive behavioral therapy. The program is however followed completely autonomuously by its participants. The program is to be followed on a daily basis for approximately 15 minutes, although certain exercises can be required to be performed throughout the day. Questions that evoke self-reflection, are the largest part of the program, supplemented by video's on specific exercises and tools and video's including information on habit forming and solution focused problem solving. The program includes participants worldwide, with most participants in Belgium.
Measurements
Symptom severity is measured via the DASS-21 questionairre filled in by all participants at the start of the 15Minutes4me.com program and each time that someone has worked on the program for seven days. The DASS is a self report instrument that was developed by Lovibond & Lovibond in 1995 and is a reliable and valid method of assessing features of depression, anxiety, and tension-stress in both clinical and nonclinical groups. The DASS-21 is part of the 15Minutes4me.com program so that participants can follow their own progress and share it with their GP or other health professional if desired, and for research purposes such as the study described here.
The DASS-21 contains seven questions for each scale. Every question is a statement for which the participant has to indicate how much the statement applied to him or her over the past week. The answer options are 0- Did not apply to me at all, 1- Applied to me to some degree, or some of the time, 2-Applied to me to a considerable deree or a good part of time, 3-Applied to me very much or most of the time. Per scale, the final score is categorised as 'normal', 'mild', 'moderate', 'severe', or 'extremely severe' according to the DASS guidelines.
Recovery speed is measured via percentage of the participants that scored 'normal' on the given DASS scale after 14 days, after 21 days, after 28 days and after 35 days. These numbers of days correspond to the number of days that a participant actually used the program. It is for example possible for someone to have participated in the program for 14 days in a time period of 20 'actual' days.
It should be noted that partial recovery can have occured for those percentages that do not yet score 'normal', but have experienced a symptom reduction from 'extremely severe' to 'severe' or 'moderate' or 'mild'. For research purposes, we have chosen to operationalise 'recovery speed' solely as percentage scoring 'normal', with a higher percentage scoring 'normal' corresponds to a higher recovery speed.
Length of time that participants had symptoms was measured via the question: 'How long have you suffered from your problem?' with answer options 'less than a month', 'less than 3 months', 'less than 6 month', less than 1 year', 'less than 2 years', 'less than 3 years', 'less than 5 years', 'less than 10 years', 'less than 20 years', 'less than 30 years', 'less than 40 years', 'more than 40 years' . This written question was posed to participants on the 6th program dat.
Sample sizes
Data was used of all participants that followed the program for at least 35 program days and had no missing data on the DASS at the start of the program and at 14, 21, 28 and 35 days.
To test whether participants with a short symptom duration recovered faster than those with long symptom duration and to test for comorbidity, a test was done for each scale with all the participants with an intial score of 'extremely severe' on that specific scale.
- For the depression scale, the sample size was 706.
- For the anxiety scale, the sample size was 1,002.
- For the stress scale, the sample size was 513.
To test whether initial symptom severity influenced recovery speed, for each scale all participants were included that initially scored either 'extremely severe' or 'severe' and had symptoms for at least one year.
- For the depression scale, the sample size was 609.
- For the anxiety scale, the sample size was 632
- For the stress scale, the sample size was 730.
Statistical method
To test the symptom duration hypothesis, the shape of the relationship between between length of time of symptoms and recovery speed was examined manually at the four measurment moments of 14 days, 21 days, 28 days and 35 days. There was not a consistent linear correlation between increased amount of time and decreased recovery speed at the four moments in time. There were only two clusters of recovery speed where recovery speed was consistently faster or slower. This was the case for the time periods less than 1 year versus more than 1 year. Within the large group of symptoms for longer period than 1 year, there was no consistent pattern of longer time correlating with slower recovery speed. The variable 'duration of symptoms' was therefor reduced to a binary variable with the two categoies 'less than one year' and 'at least one year'.
To statistically test the symptom duration hypothesis, the four recovery rates (at 14 days, 21 days, 28 days and 35 days) of participants initially scoring 'extermely severe' ánd reporting symptoms for less than one year were compared to the four recovery rates (at 14 days, 21 days, 28 days and 35 days) of participants initially scoring 'extremely severe' ánd reporting symptoms for at least one year. We used to the software environment 'R' to calculate the p-value for the statistical null hypothesis that there is no difference in recovery rates regardless of symptom duration. In order to obtain this p-value we need to know what the chances are of obtaining the specific result under this assumption of no difference. To do this, we first take the entire sample and randomly draw as many scores from this overall sample as there were participants who reported having symptoms for less than one year, as this was the smallest group. We did this for each of the four recovery rates (at 14 days, at 21 days, at 28 days and 35 days). We then checked whether the randomly drawn sample had the same or more extreme proportions than the actual sample of participants with symptoms for less than one year. This was then repeated 1000000 times. The number of times our randomly drawn sample had the same or more extreme proportions than are actual sample, is the p-value under the null hypothesis that there is no difference. If the p-value is smaller than 0.05, then the chances of the null hypothesis being correct is too small, and therefore the null hypothesis is rejected and the presence of an actual difference is accepted. This test was performed for all three scales: depression, anxiety and stress. The R code for the depression scale can be found in the appendix.
The same approach was used to test the severity hypothesis. To avoid an interaction effect with symptom duration, only the participants who had symptoms for at least one year were tested.
For more details on this type of statisical testing, see Burggraaf and colleagues, 2021.
The data for the comorbidity hypothesis did not show the pattern in the hypothesized direction. Since the pattern was not there, no statistical testing was needed. The raw data is presented in the results section to showcase the absence of the effect.
Results
Sympton severity and duration effect
The effect of previous symptom duration and intial symptom severity can seen in table 1 for depression, table 2 for anxiety and table 3 for stress, by comparing columns two and three for the symptom duration effect and columns two and four for the symptom severity effect. The recovery rates are consistently higher for shorter symptom duration and consistently higher for lower symptom severity, as was hypothesized. The P-values for the null hypothesis of symptom duration were P<.001 and P<.001 and P<.001 for depression, anxiety and stress. The P-values for the null hypothesis of symptom severity were P<.001, P<.001, P<.001 for depression, anxiety and stress, all indicating statistically significant results.
Additionally noticeable, although not statistically tested, is that the recovery rates were higher for those participants with symptoms for more than 1 year and a lower symptom severity ('severe') than those with symptoms for less than one year and higher symptom severity ('extremely severe'). This pattern is present for all three scales, hinting that symptom severity has a larger effect than symptom duration.
| 'ext. Severe' on depression scale & previous symptom duration> 1year | 'ext. Severe' on depression scale & previous symptom duration< 1year | 'Severe' on depression scale & previous symptom duration> 1 year | |
| % 'normal' on depression scale after 14 days | 14.8% | 19.9% | 23.4% |
| after 21 days | 22.7% | 30.5% | 35.4% |
| after 28 days | 31.3% | 35.3% | 41.7% |
| after 35 days | 36.3% | 41.5% | 52.6% |
| N | 432 | 272 | 175 |
| | 'ext. Severe' on anxiety scale & previous symptom duration> 1year | 'ext. Severe' on anxiety scale & previous symptom duration< 1year | 'Severe' on anxiety scale & previous symptom duration> 1 year |
| % 'normal' on anxiety scale after 14 days | 22.0 | 24.8 | 37.8 |
| after 21 days | 33.0 | 37.9 | 48.9 |
| after 28 days | 41.0 | 49.0 | 64.4 |
| after 35 days | 48.7 | 51.6 | 54.4 |
| N | 542 | 459 | 90 |
| | 'ext. Severe' on stress scale & previous symptom duration> 1year | 'ext. Severe' on stress scale & previous symptom duration< 1year | 'Severe' on stress scale & previous symptom duration> 1 year |
| % 'normal' on stress scale after 14 days | 30.4 | 36.2 | 40.2 |
| after 21 days | 40.2 | 53.6 | 58.2 |
| after 28 days | 50 | 58 | 60.3 |
| after 35 days | 53.6 | 65.2 | 66.7 |
| N | 306 | 207 | 423 |
Comorbidity hypothesis
The comorbidity hypothesis that participants that only score 'extremely severe' on depression have the highest % of 'normal' per week and participants that score 'extremely severe' on all three scales have the lowest % of 'normal' per week, was not visible in the recovery rates of depression, anxiety and stress, as can be seen in tables 4, 5 and 6. Especially noticable are the occasional higher recovery rates for those participants scoring 'extremely severe' on all three scales than the participants scoring only 'extremely severe' on one scale, which is the oppositie pattern of the hypothesized pattern.
| Previous symptom duration > 1 year & 'ext. Severe' on depression scale only | Previous symptom duration > 1 year & 'ext. Severe' on depression scale & on anxiety scale | Previous symptom duration > 1 year & 'ext. Severe' on depression scale & on stress scale | Previous symptom duration > 1 year & 'ext. Severe' on depression scale & and on anxiety ánd stress scale | |
| % 'normal' on depression scale after 14 days | 17.0 | 10.2 | 24.3 | 13.4 |
| after 21 days | 22.9 | 19.4 | 21.6 | 25.4 |
| after 28 days | 30.1 | 25.9 | 35.1 | 35.8 |
| after 35 days | 34.0 | 37.0 | 29.7 | 40.3 |
| N | 153 | 108 | 37 | 134 |
| | Previous symptom duration > 1 year & 'ext. Severe' on anxiety scale only | Previous symptom duration > 1 year & 'ext. Severe' on anxiety & depression scale | Previous symptom duration > 1 year & 'ext. Severe' on anxiety & stress scale | Previous symptom duration > 1 year & 'ext. Severe' on anxiety scale & and on depression ánd stress scale |
| % 'normal' on anxiety scale after 14 days | 23.2 | 15.7 | 24.4 | 23.9 |
| after 21 days | 34.1 | 31.5 | 26.9 | 35.8 |
| after 28 days | 40.9 | 38.0 | 34.6 | 47.0 |
| after 35 days | 51.4 | 45.4 | 42.3 | 50.7 |
| N | 220 | 108 | 78 | 134 |
| | Previous symptom duration > 1 year & 'ext. Severe' on stress scale only | Previous symptom duration > 1 year & 'ext. Severe' on stress & anxiety scale | Previous symptom duration > 1 year & 'ext. Severe' on stress & depression scale | Previous symptom duration > 1 year & 'ext. Severe' on stress scale & and on depression ánd anxiety scale |
| % 'normal' on stress scale after 14 days | 29.8 | 30.8 | 32.4 | 29.9 |
| after 21 days | 40.4 | 33.3 | 45.9 | 42.5 |
| after 28 days | 54.4 | 48.7 | 45.9 | 50.0 |
| after 35 days | 56.1 | 57.7 | 51.4 | 50.7 |
| N | 57 | 78 | 37 | 134 |
Conclusion
There is a significant relation between the recovery speed of the participants of online program 15Minutes4Me.com and initial symptom severity ('extremely severe' or 'severe') and whether someone has had complaints for less than a year or at least one year. There was no indication that the recovery speed on a single scale (depression / anxiety / stress) was affected by the presence of severe symptoms on the other scales as well.
Application of the findings
We can use this information to create overviews of recovery rates of previous participants, taking the significant variables into account. The figures plotted below provide participants and/or their GP and other health care professionals with realistic information on when they may expect symptom reduction.
Future research
Future research can further improve the prediction of recovery speed for an individual participant, by including more factors that influence recovery speed. It would be useful to know the nature of the differences between those participants that reach a 'normal' or 'mild' score after 35 days and those that remain in the 'severe' or 'extremely severe' range. Additional qualitative research for the group that remains in the 'severe' or 'extremely severe' range could also be useful, since there can be a subjective experienced improvement without a symptom reduction. Anecdotal evidence has shown that there participants with a high symptom score that choose to continue with the program on their own volition because it has a value beyond symptom reduction as measured by the DASS.
Future research should also be focused on factors influencing the total number of days that participants follow the program and the relation between these factors and recovery speed. A initial pre-liminary examination on the influence of number of days and recovery speed can be found in the second appendix.
More insight into how and for whom online programs such as 15Minutes4Me.com can support persons with mental health problems, will further improve the quality of advice given to potential participants on which steps to take and an effective supplementation of the traditional healthcare system and online possibilities. These insights will bring us closer to a reduction of the load on the healthcare system and providing immediate care for those patients who are otherwise waitlisted.
Depression recovery rates per significant variable combination
Depression 'extremely severe' and symptom duration > 1 year
Depression 'extremely severe' and symptom duration <1 year
Depression 'severe' and symptom duration > 1 year
Depression 'severe' and symptom duration < 1 year
Anxiety recovery rates per significant variable combination
Anxiety 'extremely severe' and symptom duration > 1 year
Anxiety 'extremely severe' and symptom duration < 1 year
Anxiety 'severe' and symptom duration > 1 year
Anxiety 'severe' and symptom duration < 1 year
Stress recovery rates per significant variable combination
Stress 'extremely severe' and symptom duration > 1 year
Stress 'extremely severe' and symptom duration < 1 year
Stress 'severe' and symptom duration > 1 year
Stress 'severe' and symptom duration < 1 year
References
Burggraaf, J., Groeneweg, J., Sillem, S., & van Gelder, P. (2021). What Employees Do Today Because of Their Experience Yesterday: How Incidental Learning Influences Train Driver Behavior and Safety Margins (A Big Data Analysis). Safety, 7(1), 2. MDPI AG. Retrieved from http://dx.doi.org/10.3390/safety7010002
Lovibond, S. H., & Lovibond, P. F. (1995). Depression Anxiety Stress Scales (DASS--21, DASS--42) [Database record]. APA PsycTests.https://doi.org/10.1037/t01004-000
Appendix
R code for statisical testing of the symptom duration hypothesis for the recovery from depression symptom
# Test the difference in depression recovery rates between symptoms less than a year vs longer (for the group scoring 'extremely severe' on depression)
# count how many many actual persons with score 'normal' in ext dep group with symptoms<1year
dep_extsevere<-data$p1_w1_depression>=ext_limit_dep & !is.na(data$p1_w1_depression) &
!is.na(data$p1_w3_depression) & !is.na(data$p1_w4_depression) & !is.na(data$p1_w5_depression) & !is.na(data$p1_w6_depression) &
n_normal_after14d_symptomshort<-sum(dep_extsevere & symptoms_sub1year & data$p1_w3_depression<mild_limit_dep, na.rm=T)
n_normal_after21d_symptomshort<-sum(dep_extsevere & symptoms_sub1year & data$p1_w4_depression<mild_limit_dep, na.rm=T)
n_normal_after28d_symptomshort<-sum(dep_extsevere & symptoms_sub1year & data$p1_w5_depression<mild_limit_dep, na.rm=T)
n_normal_after35d_symptomshort<-sum(dep_extsevere & symptoms_sub1year & data$p1_w6_depression<mild_limit_dep, na.rm=T)
# Pool to randomly draw from
pool<-data[dep_extsevere, colnames(data) %in% c("p1_w3_depression", "p1_w4_depression","p1_w5_depression", "p1_w6_depression")]
# simulate dep extremely severe symptoms group of size symptoms<1year under H0 hypothesis; repeat 1000000 times
n_tot_symptomshort<-sum(dep_extsevere & symptoms_sub1year, na.rm=T)
n_times<-1000000 tot<-rep(NA, n_keer)
for(i in 1:n_times){
draw<-sample(1:nrow(pool), size=n_tot_symptomshort, replace=T)
n_normal_after14d_Sim<-sum(pool[draw, "p1_w3_depression"]<mild_grens_dep)
n_normal_after21d_Sim<-sum(pool[draw, "p1_w4_depression"]<mild_grens_dep)
n_normal_after28d_Sim<-sum(pool[draw, "p1_w5_depression"]<mild_grens_dep)
n_normal_after35d_Sim<-sum(pool[draw, "p1_w6_depression"]<mild_grens_dep)
#Record whether the drawn sample is as extreme or more than actual sample (as high % 'normal' or even higher %)
tot[i]<-n_normal_after14d_Sim>=n_normal_after14d_symptomshort & n_normal_after21d_Sim>=n_normal_after21d_symptomshort & n_normal_after28d_Sim>=n_normal_after28d_symptomshort & n_normal_after35d_Sim>=n_normal_after35d_symptomshort
}
# calculate p-value by dividing the number of times true by the number of simulations
p_value<-sum(tot)/n_times
Additional data: results tables for participants who followed the program for 3 weeks and then stopped
The current research was performed on data of participants who followed the program for at least 5 weeks, to be able to investigate the recovery speed across multiple weeks. Not all participants follow the program for at least 5 weeks. Participants can stop following the program for a number of reasons. Two possible reasons that participants can stop following the program can be because they do not perceive the program to be working or the program has worked sufficiently in their perception. When using the data of participants following the program for at least 5 weeks to give a prediction of recovery speed for future participants, it is important to rule out that participants who follow the program only briefly have very different and worse recovery rates.
Future research should be focused on factors influencing the total number of days that participants follow the program and the relation between these factors and recovery speed. Below follows a preliminary initial examination to rule out that participants who follow the program only briefly have very different recovery rate. As can be seen in tables 7 (depression), 8 (anxiety) and 9 (stress), the 'normal' percentages for the participants who only followed the program for 21 program days, are the same or better than the percentages of the sample used in the main analysis. The only two exceptions are after 14 days for 'ext severe' on depression and symptom duration > 1 year (12.9% versus 14.8%) and after 21 days for 'ext severe' on depression and symptom duration < 1 year (27.8% versus 30.5%). Therefor, in all but two specific datapoints, the graphs shown in the conclusion section, show an accurate or even conservative estimate.
Depression recovery speed results of the participants following only 21 program days versus the >35 days group
| 'ext. Severe' on depression scale & previous symptom duration> 1year | 'ext. Severe' on depression scale & previous symptom duration< 1year | 'Severe' on depression scale & previous symptom duration> 1 year | |
| % 'normal' on depression scale after 14 days | 12.9% (versus 14.8% for the 5weeks group) | 17.6% (versus 19.8% for the >5weeks group) | 30.3% (versus 23.4% for the >5weeks group) |
| after 21 days | 24.0% (versus 22.7% for the 5weeks group) | 27.8% (versus 30.5% for the >5weeks group) | 38.7% (versus 35.4% for the >5weeks group) |
| N | 342 | 355 | 119 |
Anxiety recovery speed results of the participants following only 21 program days versus the > 35 days group
| | 'ext. Severe' on anxiety scale & previous symptom duration> 1year | 'ext. Severe' on anxiety scale & previous symptom duration< 1year | 'Severe' on anxiety scale & previous symptom duration> 1 year |
| % 'normal' on anxiety scale after 14 days | 24.4% (versus 22.0) | 26.4% (versus 24.8) | 62.7% (versus 37.8) |
| after 21 days | 36.5% (versus 33.0) | 37.8% (versus 37.9) | 74.6% (versus 48.9) |
| N | 405 | 402 | 61 |
Stress recovery speed results of the participants following only 21 program days versus the >35 days group
| | 'ext. Severe' on stress scale & previous symptom duration> 1year | 'ext. Severe' on stress scale & previous symptom duration< 1year | 'Severe' on stress scale & previous symptom duration> 1 year |
| % 'normal' on stress scale after 14 days | 30.8% (versus 30.4) | 27.3% (versus 36.2) | 48.0% (versus 40.2) |
| after 21 days | 46.4% (versus 40.2) | 45.5% (versus 53.6) | 60.7% (versus 58.2) |
| N | 211 | 176 | 298 |
Poster summary